
The 5-Minute Crypto Cheat Sheet
How to read any crypto situation like an analyst. Free, on this page, no signup. Four things to check, two charts that do most of the work, and a scorecard you can run in a minute.
1. Tell real traction from rented traction
A number is only a signal if it survives the incentive that created it. Before you trust a growth chart, ask what happens when the rewards stop. Real usage keeps paying for itself. Rented usage packs up and leaves the moment the subsidy ends.
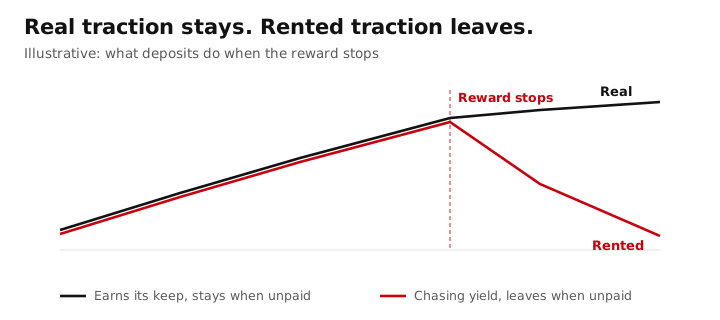
- Fees and revenue beat any vanity metric. A protocol that earns real money from real users can survive without paying people to show up.
- Prefer TVL that holds when prices fall. TVL that only grew because token prices rose, or because a high yield rented it, is not adoption.
- Count users that are not wash. A handful of addresses cycling volume is not a crowd.
2. Four questions before any trade
- Who is on the other side, and why? Every trade has a seller. If you cannot say why they are wrong, you may be the one who is.
- What is my thesis, and what would disprove it? If nothing could change your mind, it is not a thesis, it is a bag.
- What is the downside if I am wrong? Size the position to that answer, not to the upside.
- Am I early, or just wrong? They look identical for a long time. Being right too soon still costs you.
3. On-chain signals that matter, and the ones that don't
The blockchain is public, so people quote it constantly. Most of what gets quoted is noise.
- Worth watching: exchange netflows (coins leaving exchanges usually means holders are settling in), stablecoin supply (dry powder and real usage), protocol revenue, and holder concentration.
- Mostly noise: raw transaction counts, "whale alert" transfers (often just an exchange moving its own funds), and social-media volume.
4. The one chart that explains most pumps
Put price next to funding rates and open interest. The same green candle means two completely different things depending on what is underneath it.
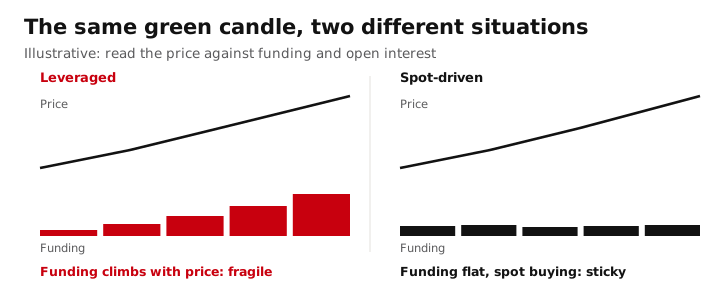
When price rises while funding and open interest climb with it, the move is powered by borrowed money, and borrowed money unwinds fast. When price rises on spot buying with funding flat, the move is slower and harder to knock over. Knowing which one you are looking at is most of the job.
The 60-second token scorecard
Run any token through these six before you act. More red flags than green, and you are gambling, not investing.
| Check | Green flag | Red flag |
|---|---|---|
| RevenueDoes it earn real fees from users, or only pay out its own token? | Fees people pay for a service they want | Growth that exists only while emissions do |
| StickinessDoes usage survive when the incentives stop? | Deposits and users hold after a reward ends | Capital leaves the week the yield does |
| ConcentrationHow much supply sits in a few wallets? | Broad distribution, modest top-10 share | A handful of wallets hold most of it |
| The moveIs this rally on spot buying or leverage? | Price up, funding flat, open interest calm | Price up, funding and open interest surging |
| The other sideCan you say who is selling to you, and why? | A clear reason they are wrong and you are right | No idea, or 'it only goes up' |
| The exitWhat single fact would prove your thesis wrong? | A specific, checkable disproof | Nothing could change your mind |
Ask what a number would look like if it were fake, then check whether it looks like that. Most of analysis is just refusing to be impressed.
Now get the Sunday briefing.
You have the cheat sheet. Once a week, we use it for you: the numbers that moved, and the reason they did. Free.
Free · Independent · Unsubscribe anytime · Privacy